I was going to use the autotrace function of the software Plotdigitizer, but couldn’t get it to work, so I wrote a program using openCV [1] to digitize figures.
Get a scale. All images used were .png format, and were screenshots (taken with Microsoft Snipping Tool) of .pdf files of research papers (viewed with Google Chrome). Open the image in Microsoft Paint, use the Select Tool, and measure the length (height or width, depending on how the measuring line is aligned) (in pixels) of some line in the image which indicates how many graph units the line is. This line may be the axes (as in purple number 1, 2, 3, and 4 of Figure 7), or may be a separate bar on the side (as in purple number 5 and 6 of Figure 7). Axes may apply to several graphs (as in all graphs of Figure 7), including the graph of interest, so you may have to screenshot several unrelated graphs so that your screenshot includes the graph.
Remove lines. Remove any axes, labels, titles, legends, graph lines, or anything except the datapoints to be digitized. See Figures 8 and 9 for examples of removing guiding dots and lines which aren’t datapoints, but are the same color of the datapoints.
Run the program. Run digitize.py, which searches for the color with the blue-green-red (BGR) lower and upper bounds specified in the code, and writes each point of that color to a comma-separated values (.csv) file. See Figures 10, 11, and 12 for examples of datapoints of a certain color extracted from a graph which has curves of various colors.

Figure 7.
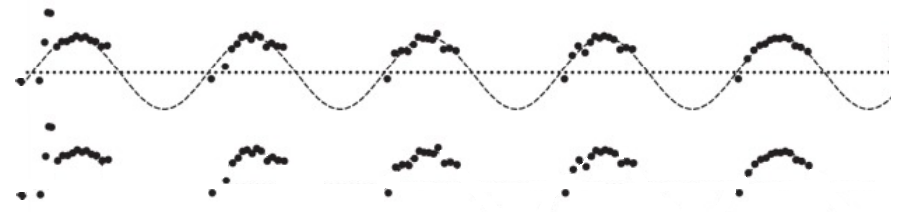
Figure 8.
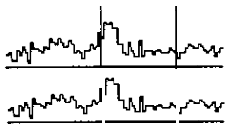
Figure 9.
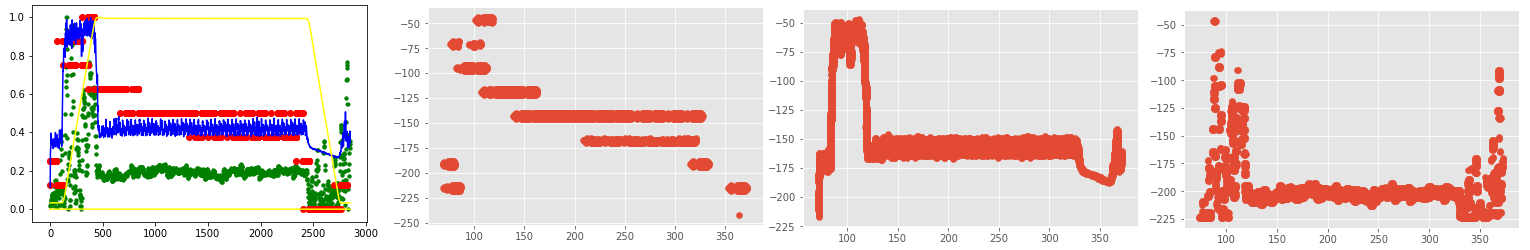
Figure 10.

Figure 11.
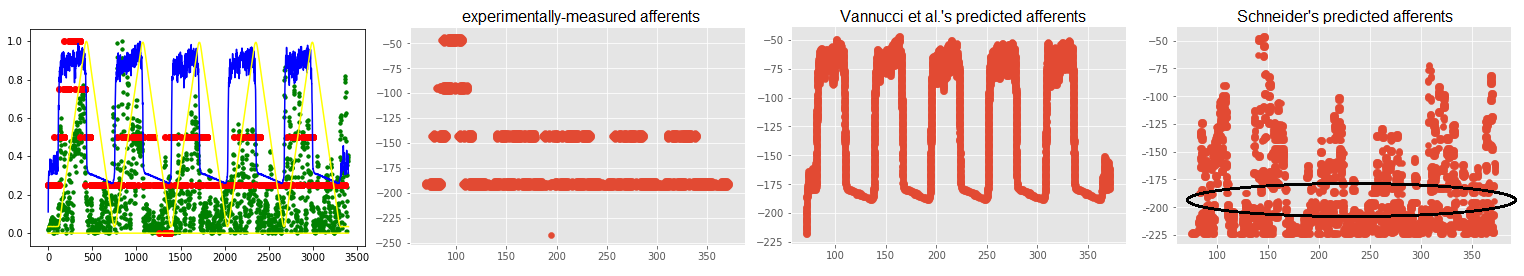
Figure 12.
[1] Bradski, G. (2000). The OpenCV Library, opencv-python version 4.1.2.30. Dr. Dobb’s Journal of Software Tools [Computer software]. Retrieved from https://opencv.org/releases/.